Categories
InvestingPublished July 29, 2026
Scranton Rental Market Update 2026: Why Rentals Are Taking Longer

Scranton Rental Market Update 2026: Why Rentals Are Taking Longer and What Landlords Can Do About It
If your rental property is taking longer to lease than it did a year or two ago, you are not imagining it.
The Scranton-area rental market has become slower, more price-sensitive and significantly more complicated. Properties are still receiving inquiries, tenants are still moving and well-positioned rentals are still leasing. However, the path from “active listing” to “qualified tenant” is taking longer, and online interest is not converting into completed leases as quickly as many landlords expect.
At Revolve Real Estate, we recently reviewed the rental activity in our MLS alongside our own lead, showing and application data. The results confirmed what landlords, leasing agents and property managers have been feeling throughout the market:
Demand has not disappeared, but renters have more choices, greater price sensitivity and more difficulty qualifying.
The good news is that landlords are not powerless. Proper pricing, better presentation, faster follow-up and professional management can substantially improve a property’s position in this changing market.
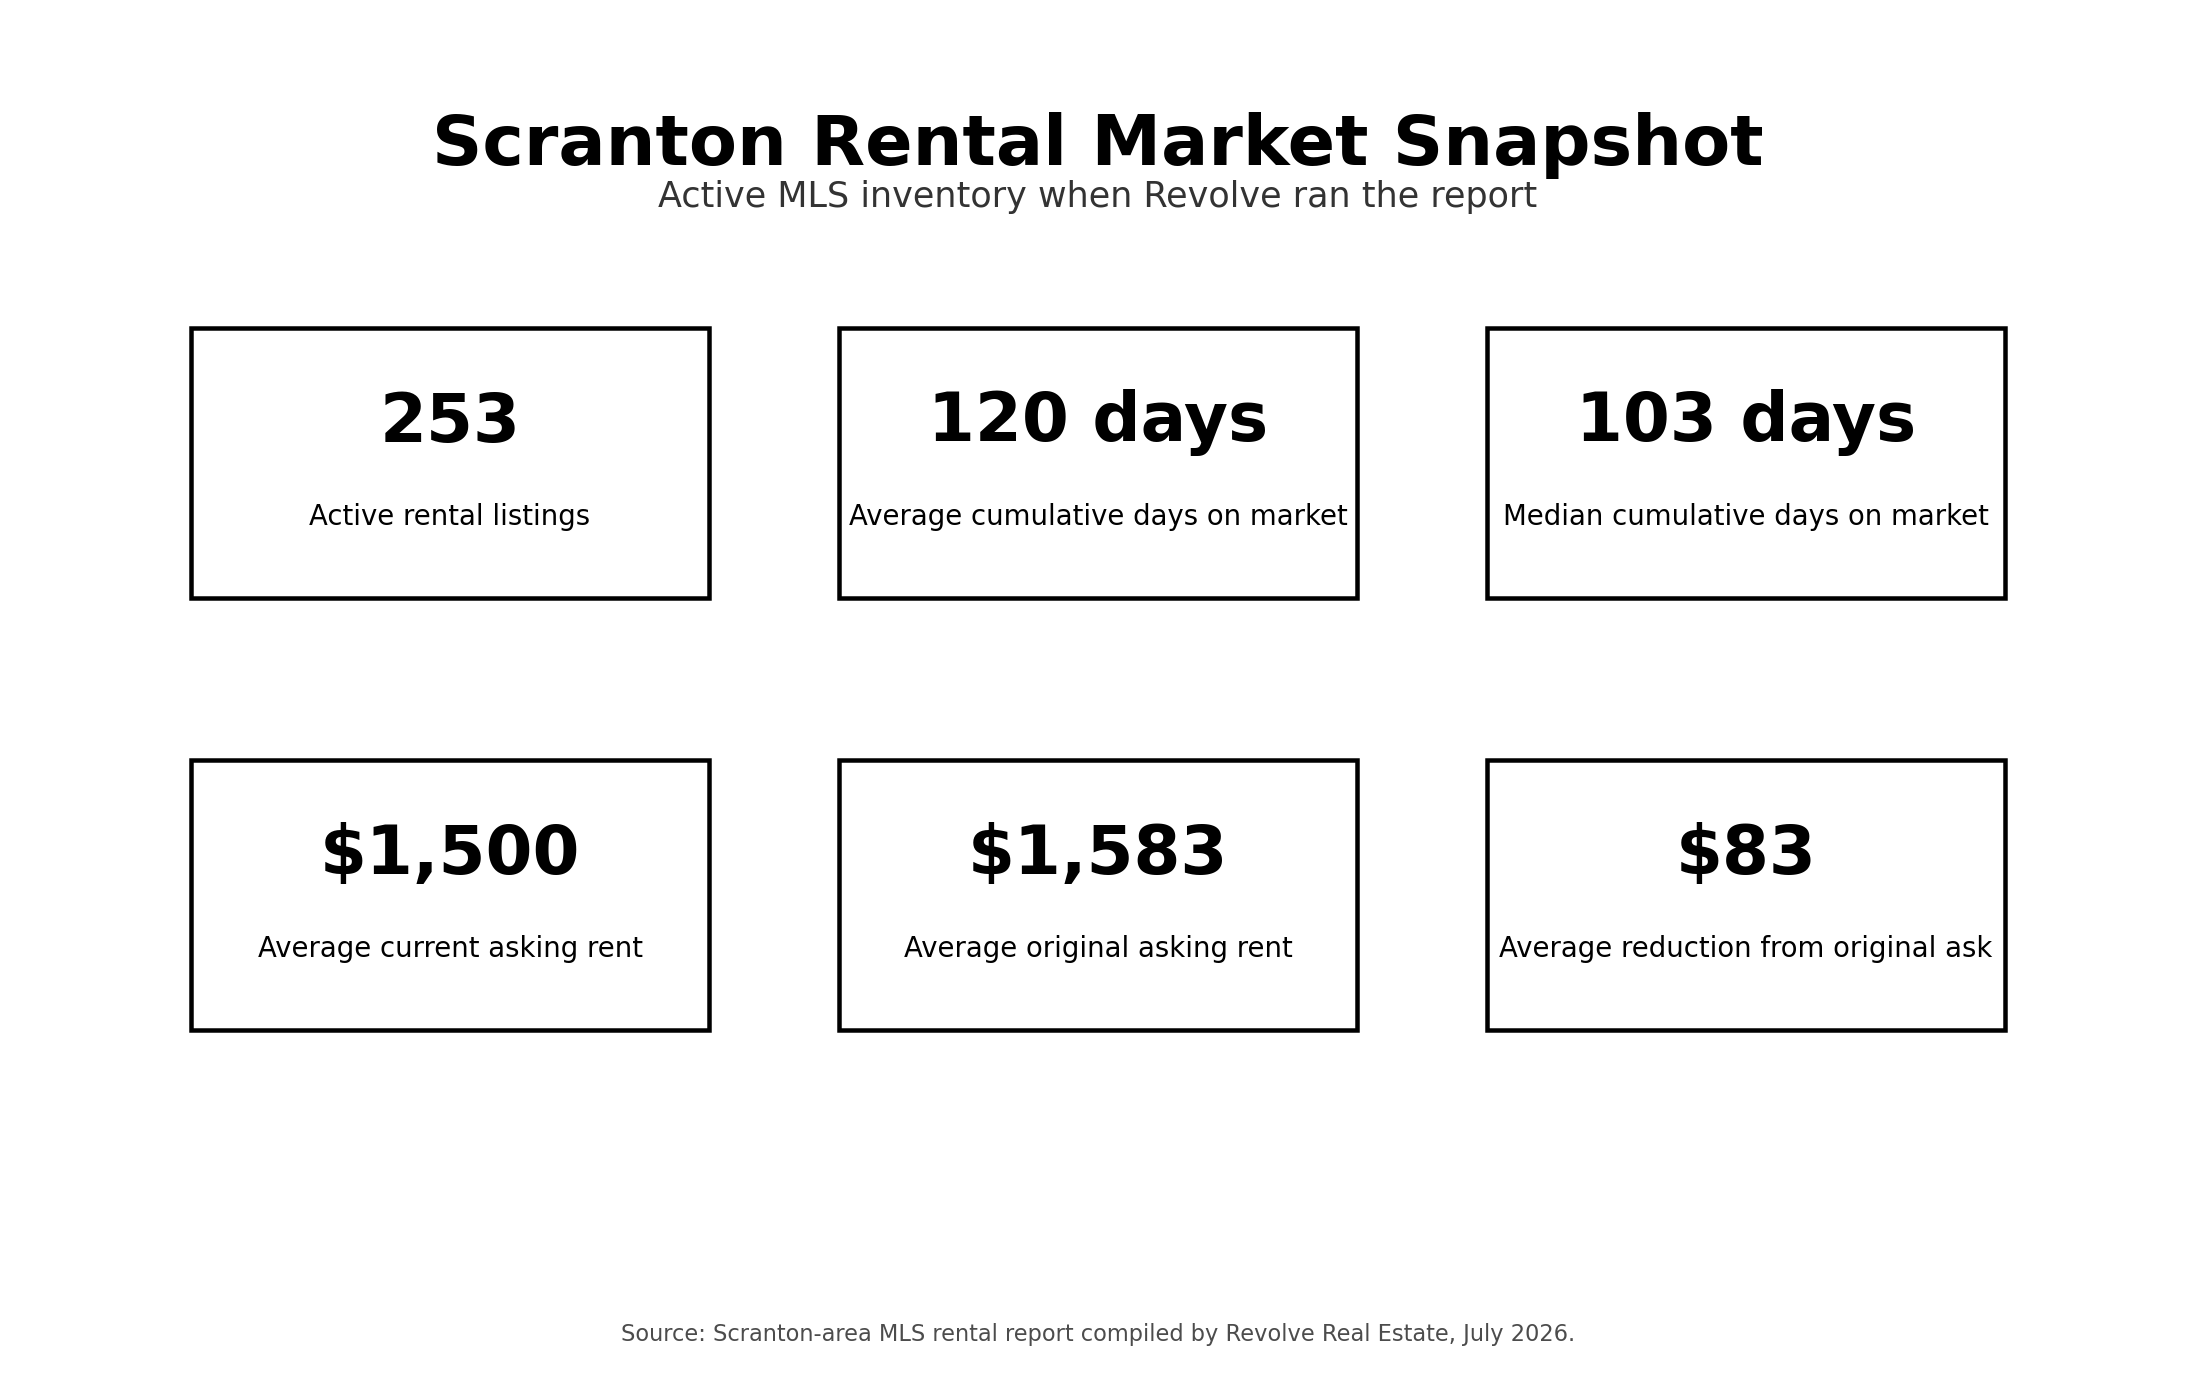
The Scranton Rental Market at a Glance
At the time of our analysis, the Scranton MLS contained:
| Current MLS Rental Inventory | Result |
|---|---|
| Active rental listings | 253 |
| Average cumulative days on market | 120 days |
| Median cumulative days on market | 103 days |
| Average original asking rent | $1,583 |
| Average current asking rent | $1,500 |
| Median current asking rent | $1,400 |
The average active rental has already been reduced by approximately $83 per month, or 5.2%, from its original asking price. More importantly, the median cumulative days on market is 103 days. That means the lengthy marketing time is not simply being caused by a few extreme listings.
The report does contain a maximum CDOM of 1,931 days, which pulls the average upward. However, a median of 103 days confirms that a substantial portion of the active rental inventory has been exposed to the market for more than three months.
Fewer Rentals Are Leasing Within the First 30 Days
The clearest trend appears when we compare cumulative days on market, or CDOM, across three different reporting periods.
CDOM is particularly useful because it reflects the cumulative market exposure shown in the MLS. It gives landlords a more complete picture than looking only at the days associated with the current listing period.
How Rental Marketing Times Have Changed
| Cumulative Market Time | Previous 365 Days, 7/29/24–7/29/25 | Most Recent 365 Days | Most Recent 6 Months |
|---|---|---|---|
| 0–30 days | 37.60% | 32.89% | 30.83% |
| 31–60 days | 21.01% | 22.99% | 17.33% |
| 61–90 days | 12.36% | 15.96% | 17.33% |
| 91–120 days | 8.56% | 11.50% | 13.67% |
| 121+ days | 20.48% | 16.67% | 20.67% |
| Total within 60 days | 58.61% | 55.88% | 48.16% |
| Total after 60 days | 41.40% | 44.13% | 51.67% |
The direction is clear.
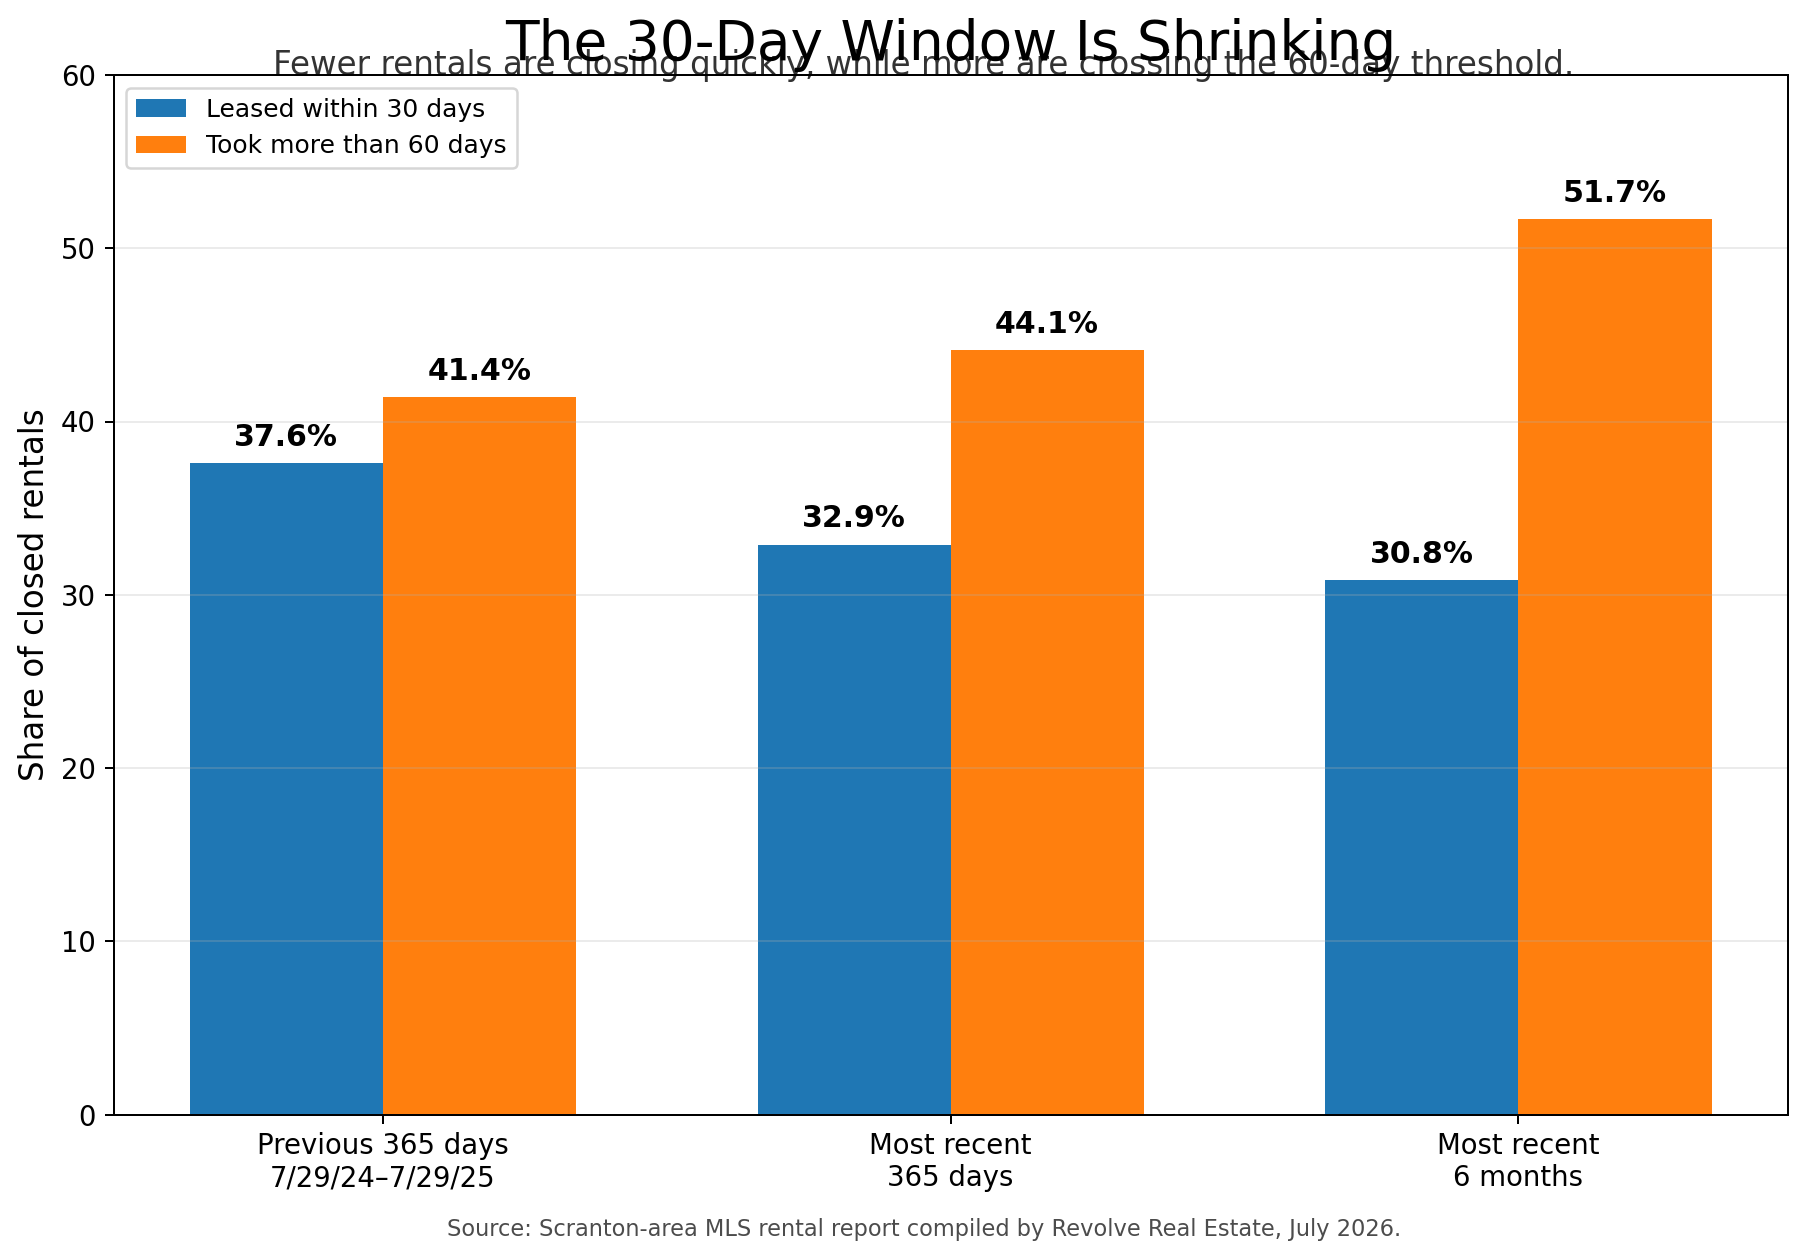
The percentage of rentals closing within the first 30 days declined from 37.60% to 32.89% and then to 30.83% during the most recent six-month period.
At the same time, the percentage requiring between 61 and 120 days increased substantially:
-
Previous 365-day period: 20.92%
-
Most recent 365 days: 27.46%
-
Most recent six months: 31.00%
In other words, nearly one-third of the rentals that closed during the most recent six months required between two and four months of cumulative market exposure.
The most recent six-month data also shows that approximately 52% of closed rentals took longer than 60 days. That is a major change from the earlier period, when approximately 41% exceeded 60 days. The share reaching 121 days or more has also returned to approximately one in five closed listings.
Why Are Fewer Rentals Leasing in Under 30 Days?
There is no single reason. The slowdown is the result of several conditions occurring simultaneously.
Renters Have More Properties to Compare
There were 253 active rentals in the Scranton MLS when the report was prepared. Zillow separately reported approximately 340 available rentals in Scranton in late July. These are not identical datasets because the MLS and Zillow capture different portions of the market, but both demonstrate that renters have a meaningful number of options. (Zillow)
When renters have more choices, they can compare:
-
Rent and total move-in cost
-
Condition and cleanliness
-
Included utilities
-
Parking
-
Laundry
-
Pet policies
-
Bedrooms and storage
-
Location
-
Lease terms
-
Application requirements
A property can be perfectly functional and still lose attention to a competing rental that photographs better, includes one more amenity or is priced only $50 to $100 lower.
This makes accurate positioning more important than simply placing a property online and waiting.
Online Interest Does Not Equal Qualified Tenant Demand
One of the most revealing parts of our analysis came from Revolve’s internal rental lead data.
During the week of July 13–17, Revolve received approximately 353 rental inquiries across our rental portfolio.
Using each stage as a sequential leasing funnel, those leads produced approximately:
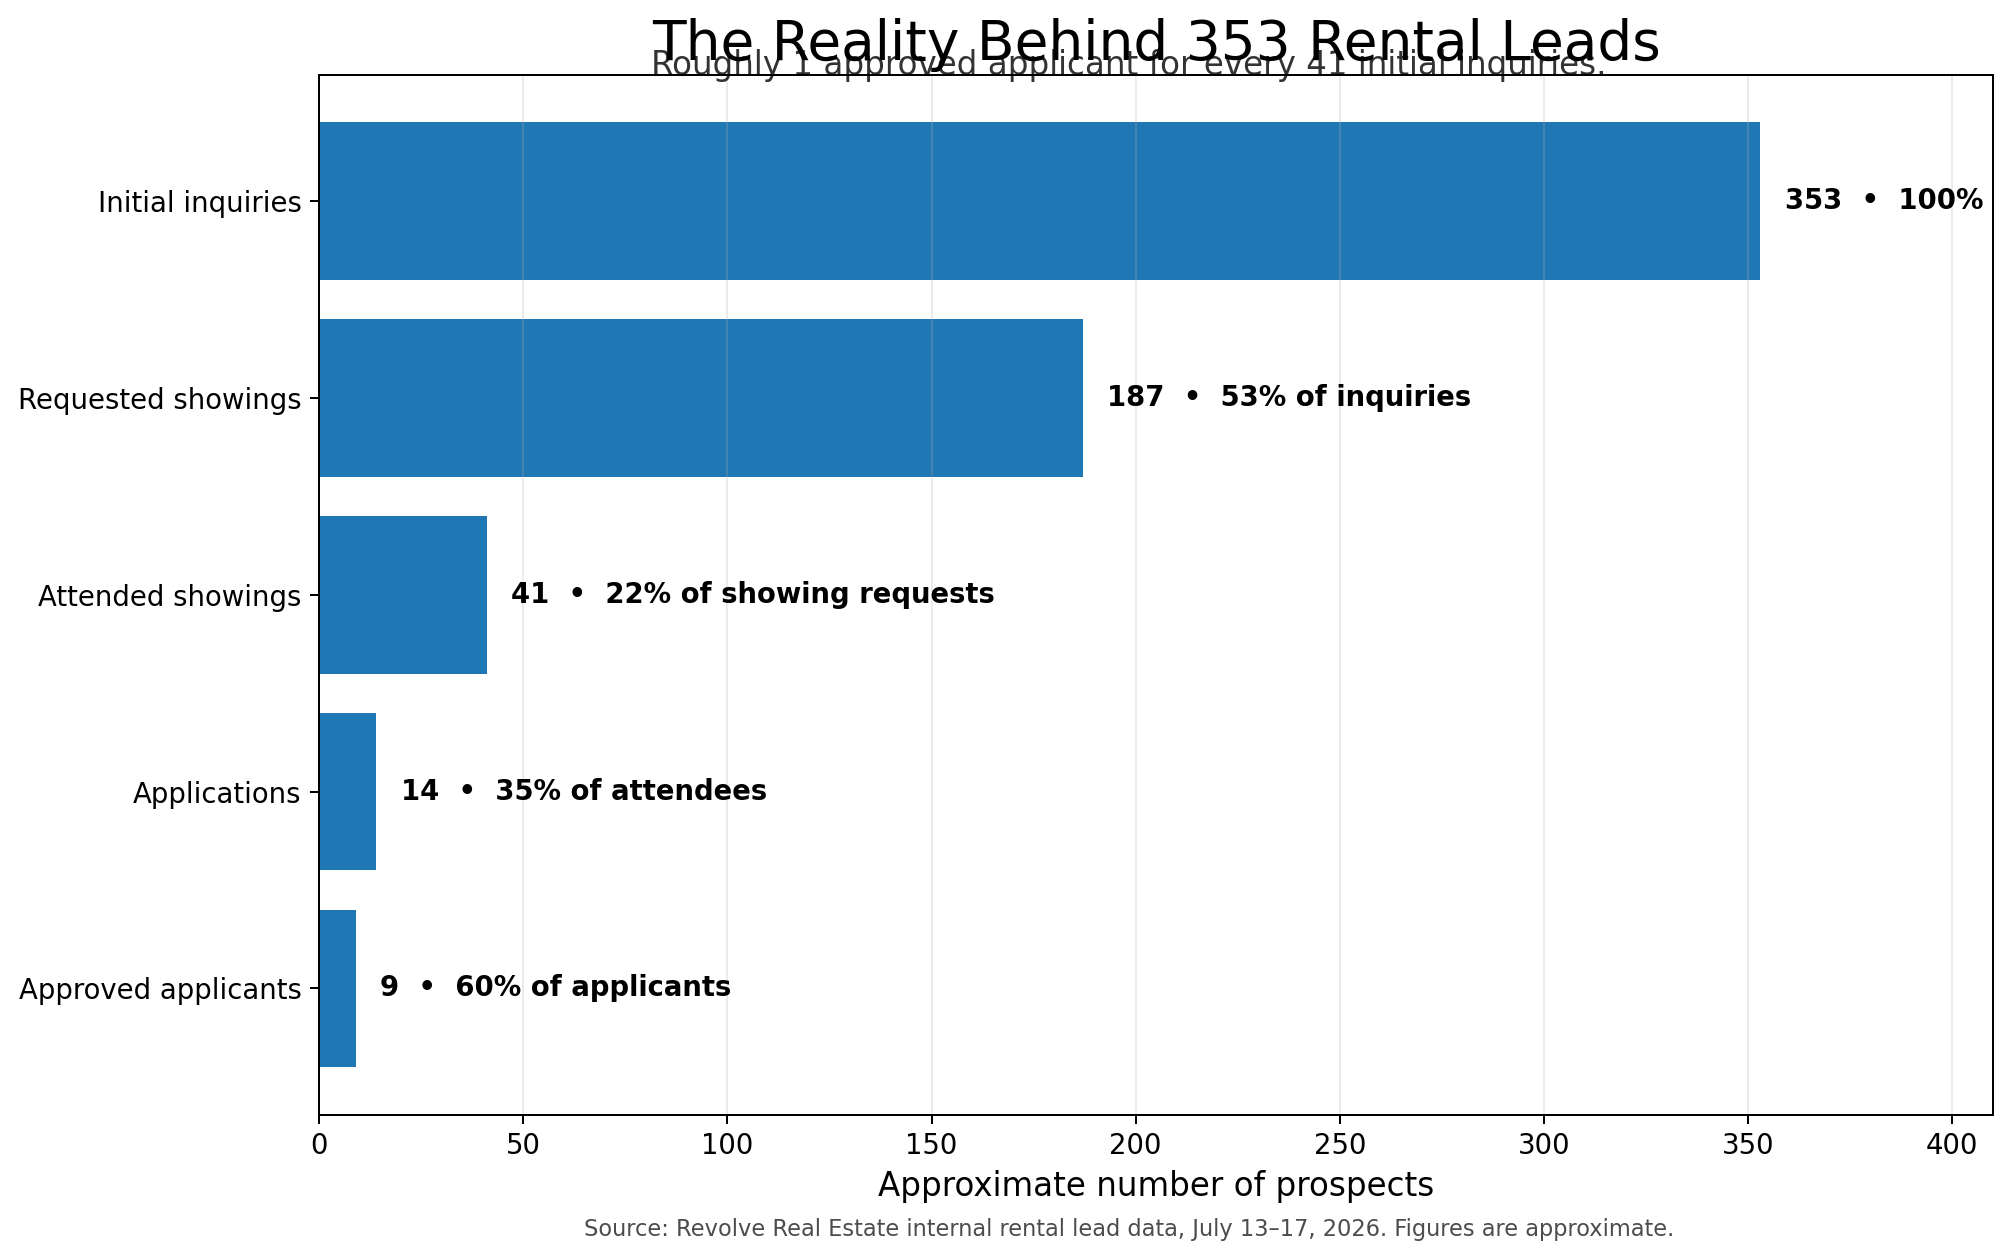
That represents an estimated overall conversion rate of approximately 2.45%.
Put another way:
It took approximately 41 initial rental inquiries to generate one qualified and approved applicant.
This is why a landlord may hear that a rental has received 20, 30 or even 50 inquiries and understandably wonder why it has not yet been leased. The inquiry count represents only the top of the funnel.
Based on this recent snapshot:
-
Approximately 47% of initial inquiries did not progress to a showing request.
-
Approximately 78% of the prospects who requested or scheduled showings did not attend.
-
Approximately 65% of showing attendees did not submit an application.
-
Approximately 40% of applicants did not ultimately qualify.
This does not mean that marketing failed. Generating 353 inquiries in one week demonstrates that renters are actively searching. The challenge is converting broad online interest into an attended showing, completed application and qualified tenant.
Source: Revolve Real Estate internal rental lead data, July 13–17, 2026. Figures are approximate and reflect activity across multiple rental listings.
Many Renters Are Financially Stretched
Affordability is another major factor.
The Federal Reserve reported in May 2026 that 23% of renters had fallen behind on rent at some point during the previous year, an increase of two percentage points from 2024 and six percentage points since 2021. The percentage was considerably higher among households earning less than $50,000. (Federal Reserve)
Harvard’s Joint Center for Housing Studies has also reported persistent affordability challenges, slowing household formation and greater economic uncertainty among younger adults. Those conditions can reduce the number of people who are ready and financially able to form a new rental household. (Joint Center for Housing Studies)
That helps explain why Revolve can receive substantial inquiry volume but see only 60% of completed applications ultimately approved.
A prospective tenant may genuinely want a property but still struggle with:
-
Income requirements
-
Credit history
-
Prior rental history
-
Deposit and move-in funds
-
Existing monthly debt
-
Utility costs
-
Timing of employment or relocation
This creates a major distinction between general renter interest and qualified renter demand.
The Broader Rental Market Has Become More Competitive
The slowdown is not limited to Northeast Pennsylvania.
Apartment List reported that the national multifamily vacancy rate reached 7.2% in June 2026. Units in its dataset were taking an average of 30 days to lease, three days longer than during the same period one year earlier. National median rent was also down 1.2% year over year. (Apartment List)
Zillow reported that 39.7% of rental listings nationally offered some form of concession in June, compared with 35.2% one year earlier. Although Scranton does not necessarily mirror the national concession rate, the data illustrates the greater leverage renters have gained in many markets. (Zillow)
Local MLS rentals and national professionally managed apartments are not directly comparable. However, both datasets point toward the same broader condition: landlords are competing more aggressively for qualified tenants.
Are Rental Prices Actually Falling?
The answer requires more context than a simple yes or no.
Average Asking Rents Have Declined
During the previous 365-day reporting period, closed rentals had an average list price of approximately $1,649 per month.
During the most recent 365-day period, the average list price was approximately $1,432 per month.
That represents a decline of approximately $217 per month, or 13.2%, in the average listed rent.
However, this does not necessarily mean that the same properties lost 13.2% of their value. Average rent can change because the mix of properties being leased changes. A period containing more studios, one-bedroom apartments or lower-priced units will produce a lower average than a period containing more single-family homes, larger apartments or luxury rentals.
Average Closed Rent Actually Increased Slightly
The average closed rent tells a different story:
| Period | Average List Price | Average Closed Price | Aggregate Difference |
|---|---|---|---|
| Previous 365-day period | $1,649 | $1,235 | $414 |
| Most recent 365 days | $1,432 | $1,255 | $177 |
The average closed rent increased from approximately $1,235 to $1,255, an increase of about $20 per month.
Therefore, the MLS data does not support the conclusion that achieved rents have broadly collapsed.
Instead, it suggests that:
-
The mix of properties entering and closing in the MLS has changed.
-
Landlords and agents may be starting closer to the amount tenants are actually willing to pay.
-
Some of the unusually high asking prices in the earlier period did not translate into equally high closed rents.
-
The gap between average asking and closed rent has narrowed considerably.
The earlier period contained an aggregate difference of approximately 25.1% between average list and average closed price. In the most recent period, that difference narrowed to approximately 12.4%.
Local Rent Values Are Showing Short-Term Softness, Not a Collapse
Zillow’s quality-adjusted rent index placed the typical Scranton rent at approximately $1,315 in June 2026. That figure was down 1.1% from the previous month but still up 3.2% from one year earlier. (Zillow)
That distinction matters.
The market is showing short-term pricing pressure and longer leasing times, but local rents remain above their year-earlier level when the differences in property quality and inventory are controlled for.
The data gives landlords reason to be realistic, but not pessimistic.
Rental Reductions Become More Common After the First 30 Days
The MLS sold-price-to-original-list-price ratios also help explain the effect of extended market time.
| CDOM Window | Previous Period: Closed Price as % of Original | Most Recent 6 Months |
|---|---|---|
| 0–30 days | 98.58% | 99.07% |
| 31–60 days | 98.70% | 95.71% |
| 61–90 days | 95.11% | 94.56% |
| 91–120 days | 93.61% | 98.88% |
| 121+ days | 94.58% | 98.07% |
Individual categories can be influenced by listing mix, unusual transactions and MLS data entry. Therefore, these figures should not be interpreted as a guaranteed price reduction for every property.
The most consistent lesson is that rentals securing tenants during the first 30 days retained approximately 99% of their original asking price. Once listings crossed the 30-day mark, greater reductions from the original asking price became more common, particularly in the 31-to-90-day windows.
This is why “testing the market” at an inflated price can be expensive.
An overpriced rental may eventually be reduced to the amount it should have been listed for originally, but only after losing the most valuable period of online exposure.
The Real Cost of Waiting for a Higher Rent
Landlords naturally want to maximize monthly income. However, the highest advertised rent does not always produce the highest annual return.
Consider a simplified example:
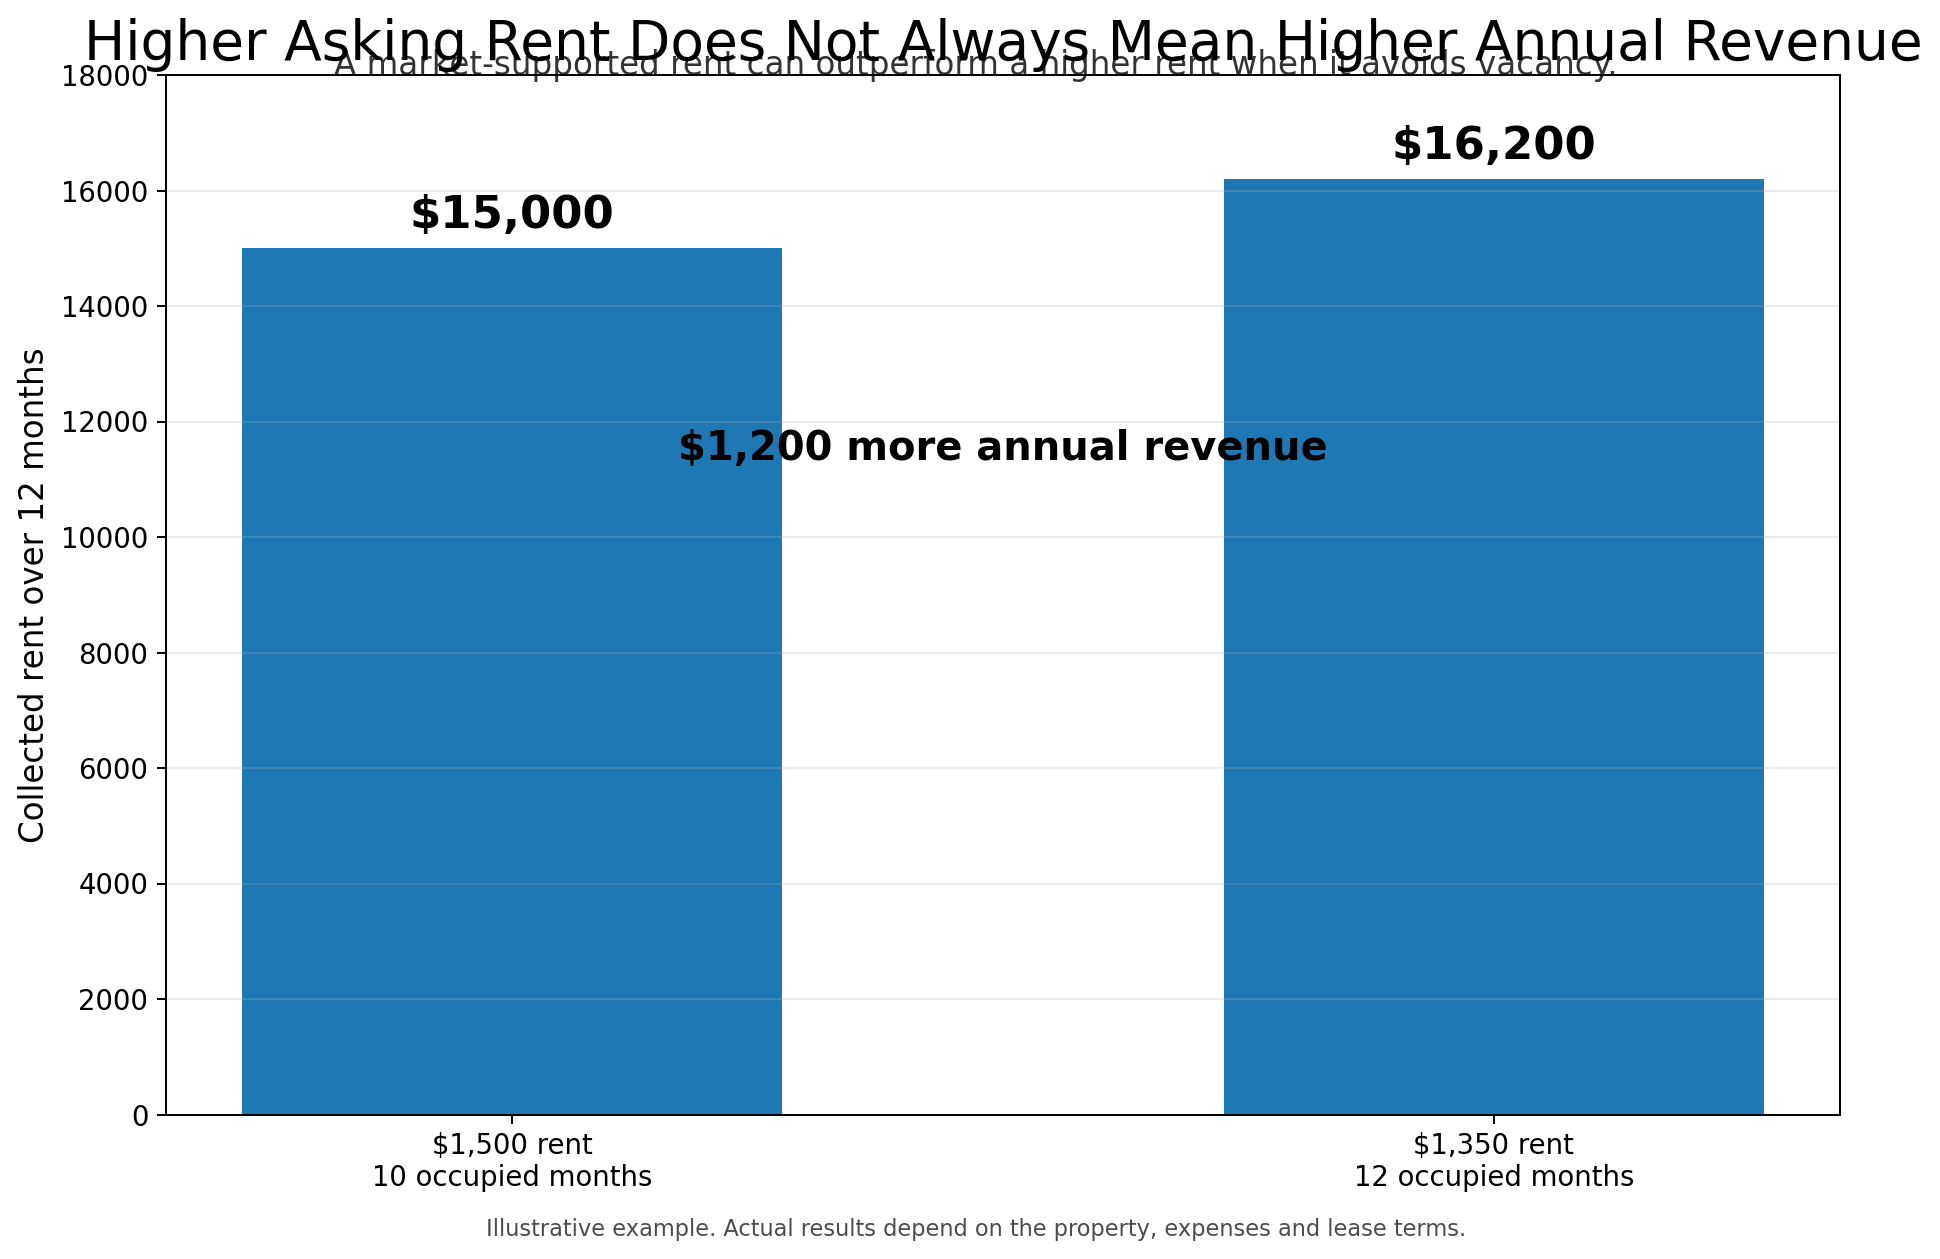
Option A: Hold Firm at $1,500
If the property remains vacant for two months and then rents for the remaining 10 months:
$1,500 × 10 months = $15,000 collected rent
Option B: Price at $1,350 and Lease Immediately
If the property rents for the full 12 months:
$1,350 × 12 months = $16,200 collected rent
In this example, the lower-priced rental produces $1,200 more annual revenue, before considering the owner-paid utilities, lawn care, snow removal, insurance exposure or maintenance associated with a vacant property.
At $1,500 per month, every vacant day represents approximately $50 in unrealized rent. A 30-day vacancy costs approximately $1,500.
A landlord holding out for an additional $150 per month would need 10 occupied months just to recover the cost of one extra vacant month.
Graphic Recommendation: “Rent Versus Revenue”
Compare $1,500 for 10 occupied months, totaling $15,000, against $1,350 for 12 months, totaling $16,200.
This does not mean landlords should automatically accept the lowest possible rent. It means the correct goal should be maximum net annual income, not simply the highest monthly asking price.
How to Tell Why a Rental Is Not Converting
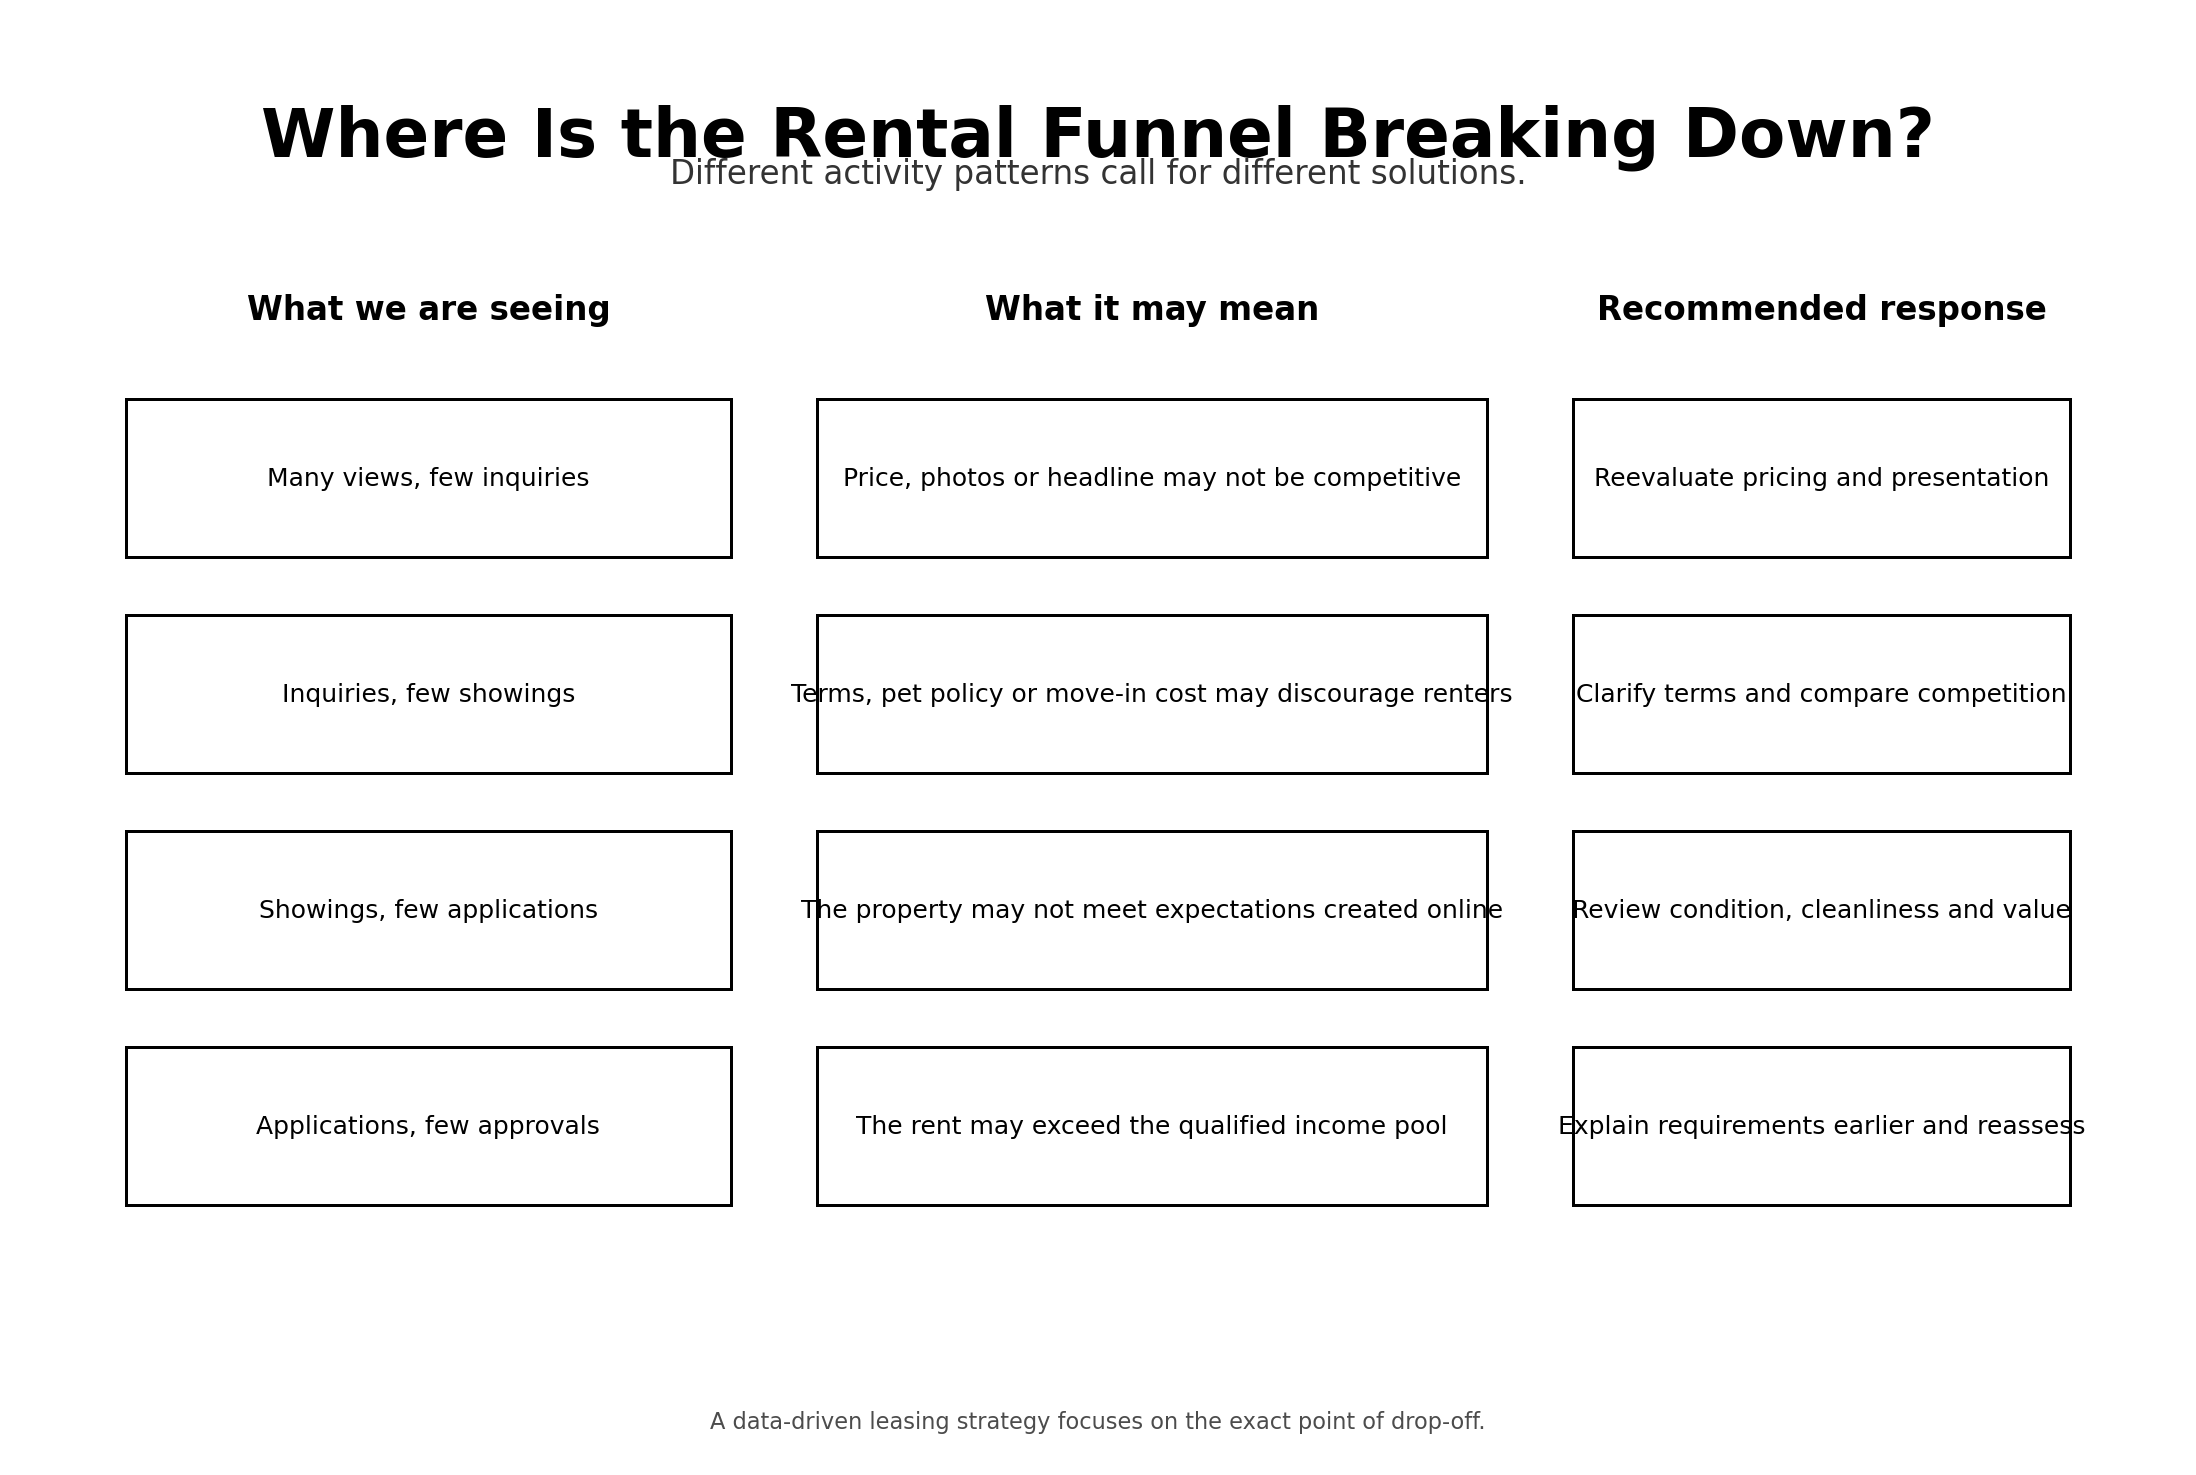
Different types of activity point to different problems.
| What We Are Seeing | What It May Indicate | Recommended Response |
|---|---|---|
| Many online views but few inquiries | Price, photos or headline are not competitive | Reevaluate pricing and presentation |
| Inquiries but few showing requests | Terms, availability, pet policy or total move-in cost may be discouraging renters | Clarify terms and compare direct competition |
| Many scheduled showings but low attendance | Low-intent leads, insufficient confirmation or renters scheduling several options | Pre-screen, confirm and send reminders |
| Showings occur but applications do not follow | The property may not meet expectations created by the listing | Review condition, cleanliness, pricing and showing feedback |
| Applications are submitted but few qualify | Advertised rent may exceed the qualified income pool, or criteria may not be clear early enough | Communicate requirements before showings and reassess target market |
| Qualified applicants hesitate | Competing properties may offer better value, lower move-in cost or stronger amenities | Consider a targeted concession or improved terms |
This is one reason professional leasing is so valuable in a slower market. It allows the owner to identify where the process is breaking down instead of responding to every problem with the same solution.
What Landlords Can Do to Reduce Vacancy
Price for Today’s Market From the Beginning
Landlords should evaluate the properties renters can choose today, not the rent a neighbor received two years ago.
A strong rental analysis should compare:
-
Similar bedroom and bathroom count
-
Condition and renovation level
-
Square footage
-
Neighborhood
-
Parking
-
Laundry
-
Utilities
-
Pet policies
-
Outdoor space
-
Current competition
-
Recent closed rentals
The first seven to 14 days generally provide the clearest indication of whether the market accepts the property’s position.
A lack of serious activity should not be dismissed as bad luck. It should trigger a review of price, terms and presentation.
Complete Repairs and Cleaning Before Marketing
A rental should be show-ready when the listing becomes active.
Launching early with unfinished repairs, leftover belongings, poor lighting or incomplete cleaning can waste the period when the listing receives its strongest online attention.
Prospective tenants frequently decide whether a property feels well-managed based on its condition during the initial showing. Small unfinished items can create concern about how future maintenance will be handled.
Invest in Professional Presentation
A rental listing competes visually before it ever competes physically.
Professional-quality photographs, proper lighting, complete room coverage and accurate descriptions help tenants understand the property before scheduling. This can increase serious showing requests while reducing appointments from people whose needs do not match the rental.
The goal is not merely to generate more inquiries. The goal is to attract better-matched inquiries.
Make the Terms Easy to Understand
Listings should clearly explain:
-
Monthly rent
-
Security deposit
-
Utilities
-
Pet rules and fees
-
Parking
-
Laundry
-
Lease length
-
Availability date
-
Application requirements
-
Occupancy limits
-
Smoking policy
-
Included services
Clear information can reduce wasted showings and help prospects determine whether they are financially and practically suited to the property.
Reduce Showing No-Shows
Revolve’s internal data shows that showing attendance is one of the largest points of lead loss.
Attendance can often be improved through:
-
Prompt initial response
-
Basic pre-screening before scheduling
-
Confirmation messages
-
Same-day reminders
-
Easy rescheduling
-
Accurate directions and access instructions
-
Virtual tours for relocating prospects
-
Follow-up after missed appointments
Not every no-show can be prevented. However, a structured process reduces the amount of leasing time spent chasing prospects who are unlikely to move forward.
Use Strategic Concessions Instead of Waiting Indefinitely
A limited concession can sometimes protect the face rent while reducing the cost of vacancy.
Examples may include:
-
A one-time move-in credit
-
Reduced first-month rent
-
A reduced pet fee
-
A longer lease at the same monthly rent
-
Including a utility or service
-
A reduced deposit where legally and financially appropriate
The concession should be compared against the cost of another month of vacancy.
A $300 move-in credit may be preferable to losing $1,500 from an additional vacant month.
Begin Renewal Planning Before the Lease Ends
The least expensive vacancy is often the one that never occurs.
Owners and property managers should begin renewal conversations well before the expiration date. This provides time to determine whether the tenant plans to stay, evaluate a reasonable rent adjustment and prepare a leasing strategy if the property will become available.
Waiting until the final weeks of the lease can create an avoidable gap between tenants.
A Practical 30-Day Leasing Strategy
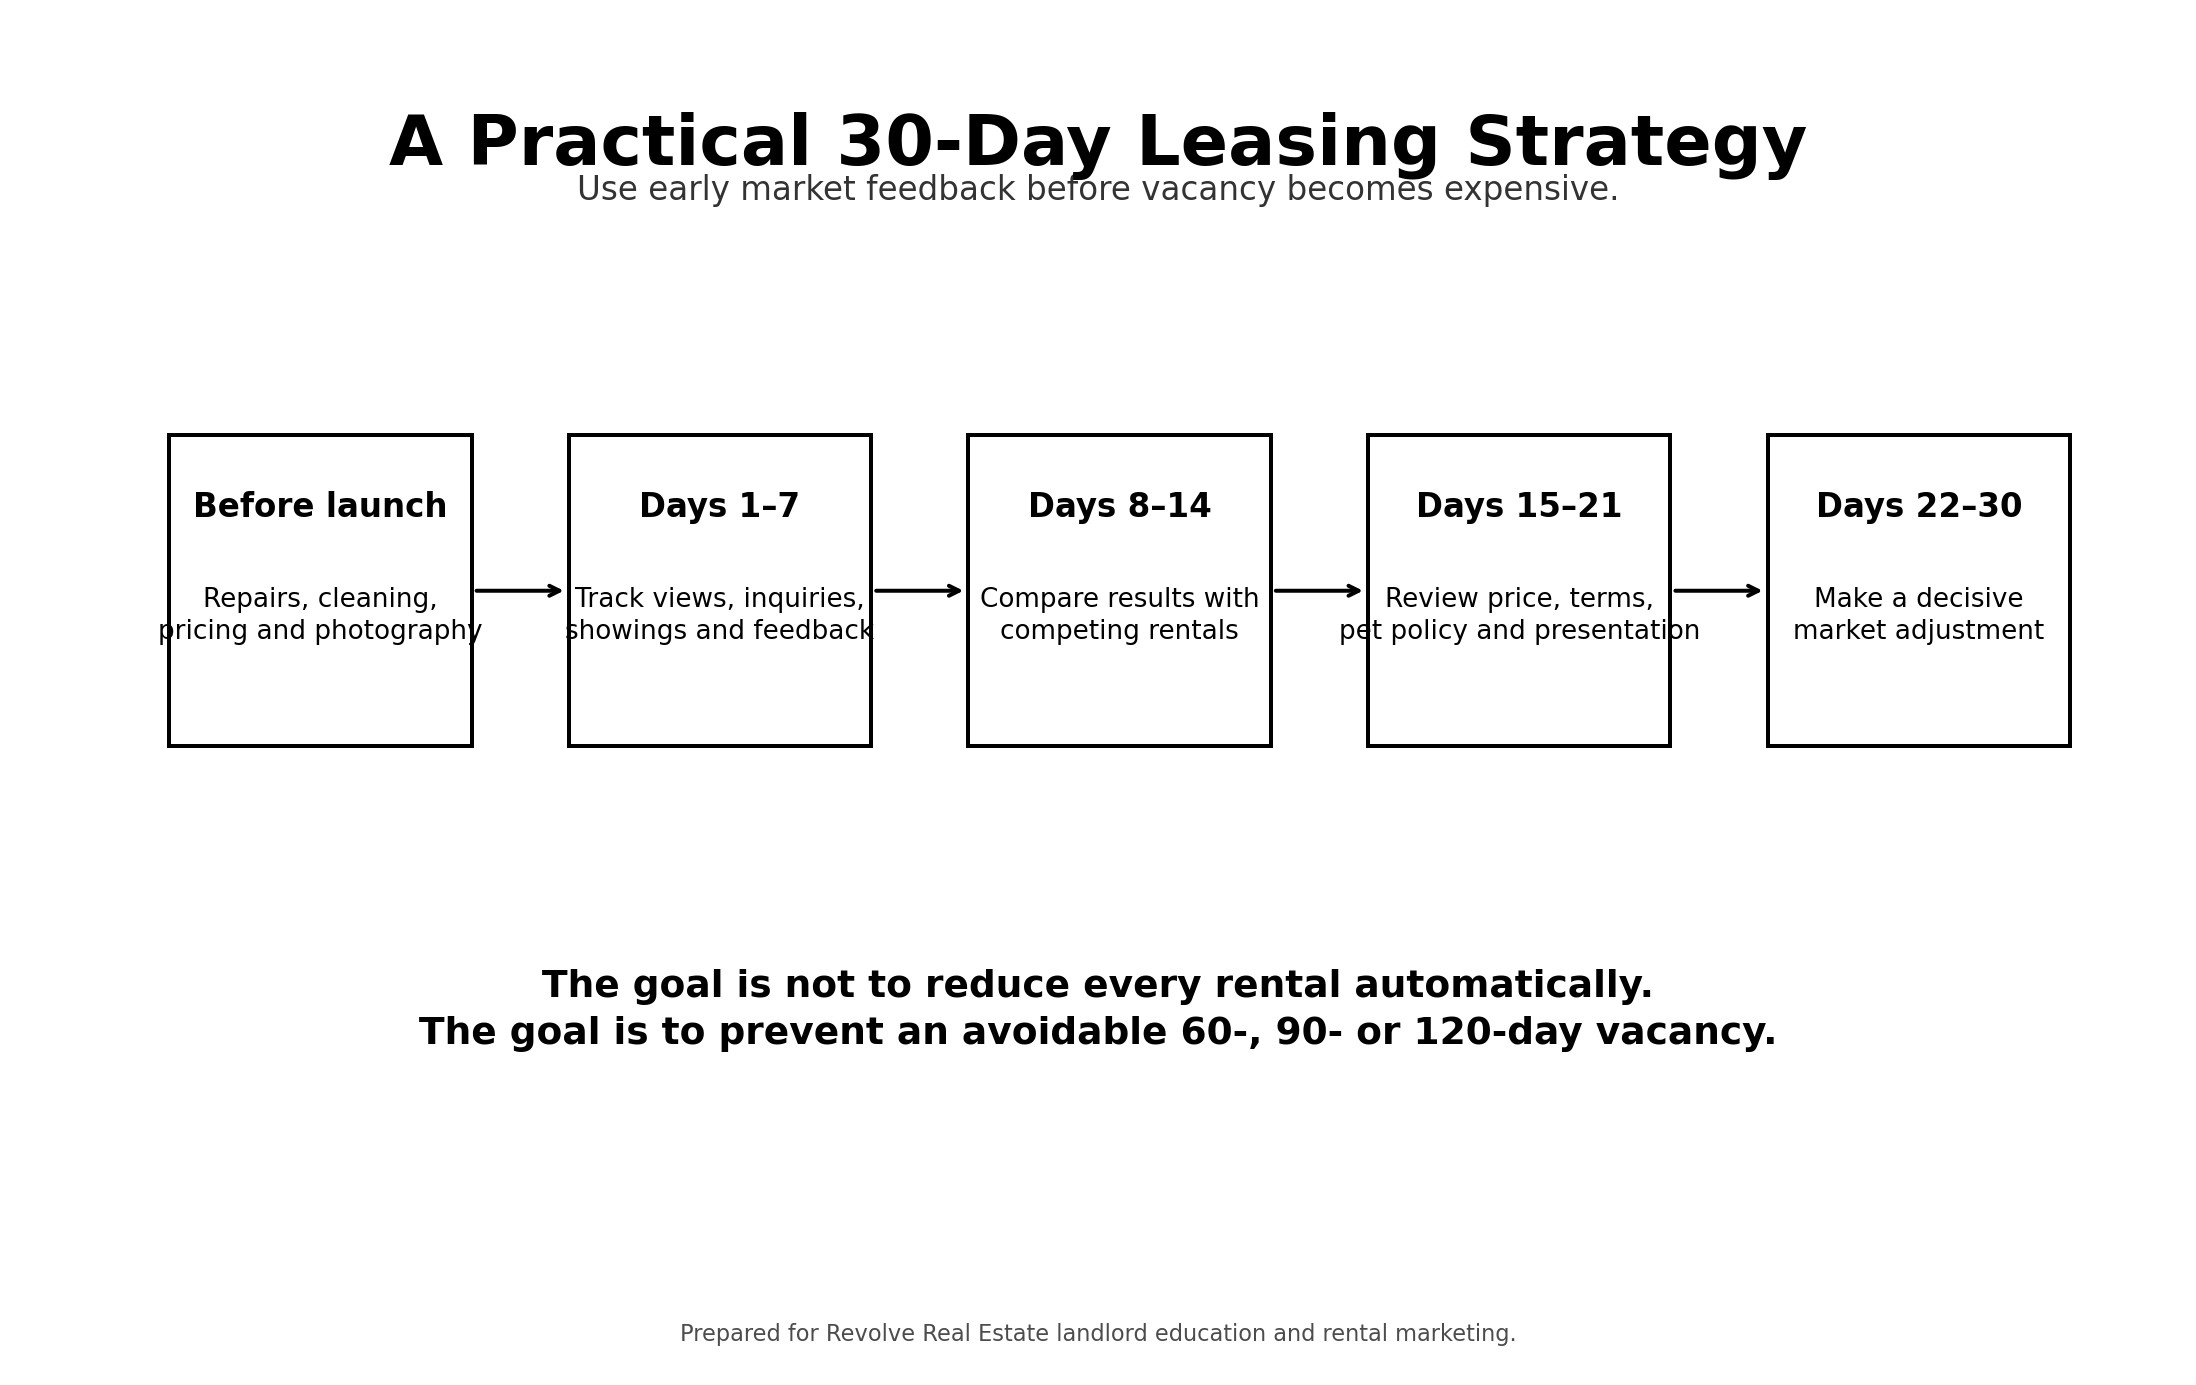
The purpose of this schedule is not to reduce every rental automatically.
It is to prevent a property from sitting for 60, 90 or 120 days without a clear explanation or strategy.
Why Professional Property Management Matters More in a Slower Market
In an extremely fast rental market, almost any reasonably priced property may attract multiple applicants quickly.
A slower market exposes weaknesses in pricing, marketing, communication and follow-up.
Professional management becomes more valuable because successful leasing now requires coordination across the entire process:
Market analysis → preparation → marketing → lead response → pre-screening → scheduling → reminders → showings → feedback → applications → verification → approval → lease preparation → move-in
Revolve’s internal data demonstrates the workload behind the final result. More than 350 inquiries generated only about nine qualified approvals during one recent week.
Each inquiry must still be answered. Each prospect must be evaluated, scheduled, reminded, followed up with and, when appropriate, moved through the application process.
Simply placing a listing online is not the same as actively managing the leasing funnel.
At Revolve Real Estate, our goal is to help landlords understand not only whether a rental is receiving activity, but what that activity means.
A property with few inquiries requires a different response than a property with numerous showings but no applications. A property producing applications that do not qualify requires a different strategy than one receiving no applications at all.
Professional management allows those distinctions to guide the next decision.
There Is Still Reason for Landlords to Be Optimistic
The rental market has slowed, but demand has not disappeared.
Revolve received approximately 353 rental inquiries in a single week. Zillow’s quality-adjusted local rent measure remained 3.2% above its year-earlier level in June. (Zillow)
The challenge is not a complete absence of renters.
The challenge is matching each property with a renter who:
-
Wants the property
-
Can afford the property
-
Meets the requirements
-
Is prepared to move
-
Sees sufficient value compared with the competition
Landlords who adjust to the current market can still achieve strong results.
That means pricing accurately, preparing the property before it is listed, presenting it professionally, responding quickly, tracking conversion and making data-driven adjustments before vacancy becomes expensive.
The Bottom Line
The Scranton rental market is not functioning the same way it did during periods when properties routinely rented within days.
Fewer rentals are closing within 30 days. More are crossing the 60-day threshold. Approximately one in five recent closings required more than 120 days of cumulative market exposure. Active rentals currently average 120 CDOM, with a median of 103 days.
At the same time, the market is not collapsing.
Average closed rent increased slightly in the most recent annual comparison, local quality-adjusted rent remains above last year’s level and renter inquiries remain substantial.
The current market rewards landlords who are proactive rather than reactive.
The properties most likely to succeed are the ones that are:
-
Priced correctly from the start
-
Clean and ready to show
-
Presented professionally
-
Easy to understand
-
Managed with consistent follow-up
-
Adjusted according to actual conversion data
A longer leasing window does not automatically mean a landlord, agent or property manager is failing. It means performance must be measured against current market conditions rather than outdated expectations.
With the right strategy, landlords can reduce vacancy, protect long-term income and secure better-qualified tenants.
Let Revolve Build a Leasing Strategy for Your Property
Revolve Real Estate provides rental marketing, tenant placement and full-service property management throughout Scranton and Northeast Pennsylvania.
Our team analyzes the property, current competition, lead activity, showing results, application quality and vacancy cost to develop a strategy based on real market evidence.
Whether you are preparing to list one rental, managing a growing investment portfolio or struggling with an extended vacancy, the right pricing and management plan can make a measurable difference.
Contact Revolve Real Estate to request a rental analysis or learn more about our property-management services.
Methodology Note: MLS figures were generated from Scranton-area rental reports prepared on or around July 29, 2026. Charted CDOM percentages were used for the detailed comparisons. The written MLS summary contains a small discrepancy in its trailing-365-day within-60-day calculation, but the overall direction of the trend remains unchanged. Average rental figures may be affected by differences in property type, bedroom count, condition, listing practices and inventory composition.
or another way